Using HiPlot
Experiment visualisation with high dimensional plotting.
HiPlot is a
lightweight interactive visualization tool to help AI researchers discover
correlations and patterns in high-dimensional data using parallel plots and
other graphical ways to represent information. Our hiplot-mlflow library
implements an MLFlow experiment fetcher plugin for HiPlot to enable visualising
experiments.
To use hiplot-mlflow, install it on your server,
or add it as a Python 3 package in a custom environment.
For details on how to use HiPlot’s interactive visualisation, please refer to their documentation.
Using HiPlot in a notebook
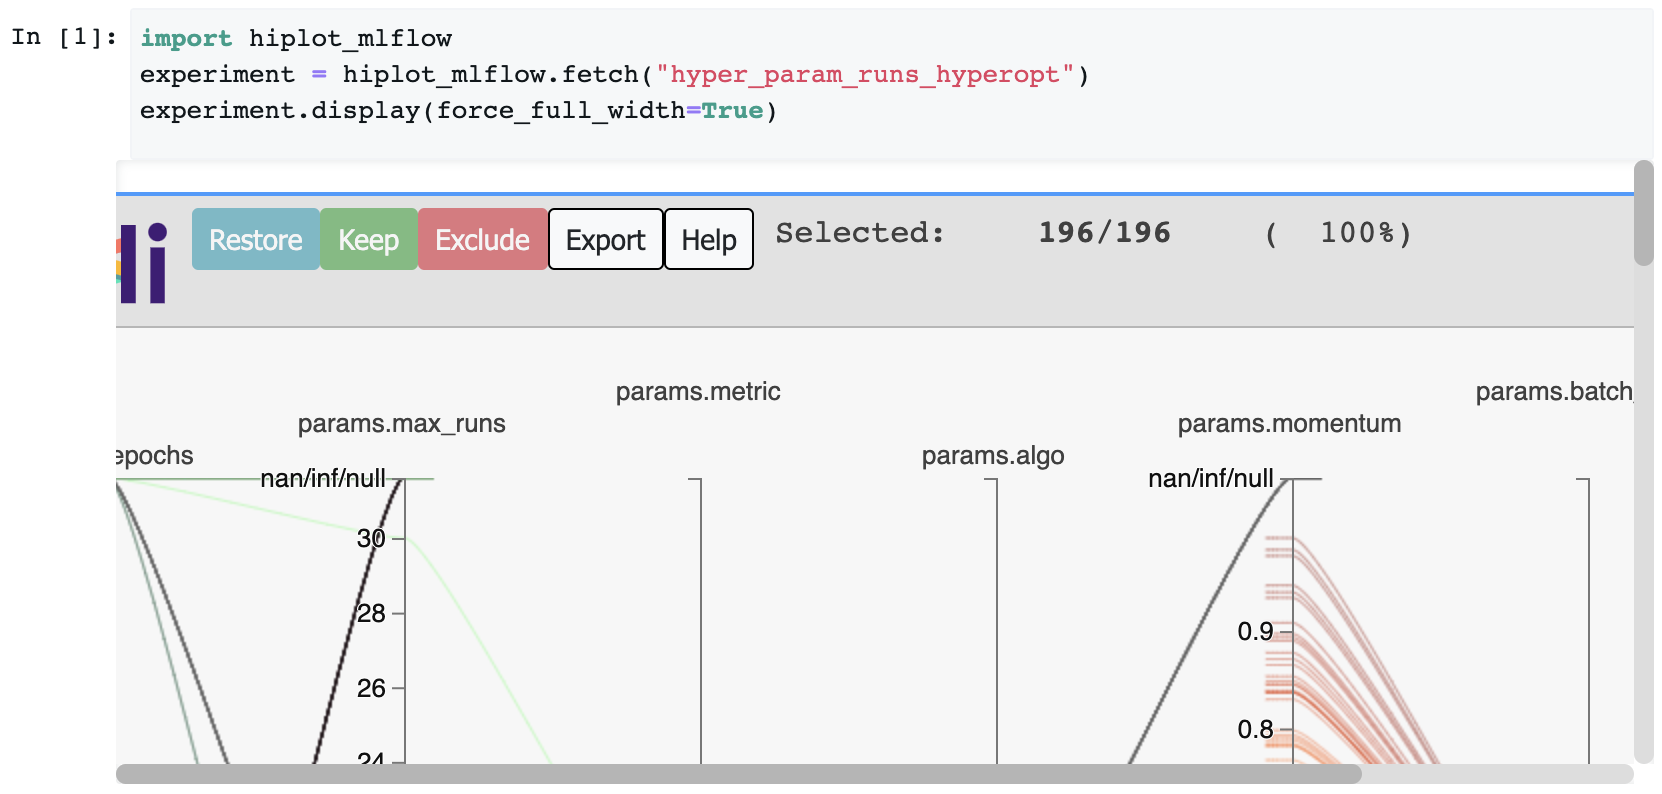
In Jupyter notebooks use the hiplot_mlflow.fetch function to retrieve
an MLflow experiment by name, and display it with HiPlot:
import hiplot_mlflow
experiments = hiplot_mlflow.fetch("my-lovely-experiment")
experiments.display(force_full_width=True)
By default MLflow tags are not shown (only MLflow metrics and parameters).
To display tags as well, pass include_tag=True to the fetching functions,
for example:
experiment = hiplot_mlflow.fetch("my-lovely-experiment", include_tags=True)
See more about what you can do with the returned hiplot.Experiment object
in the HiPlot documentation.
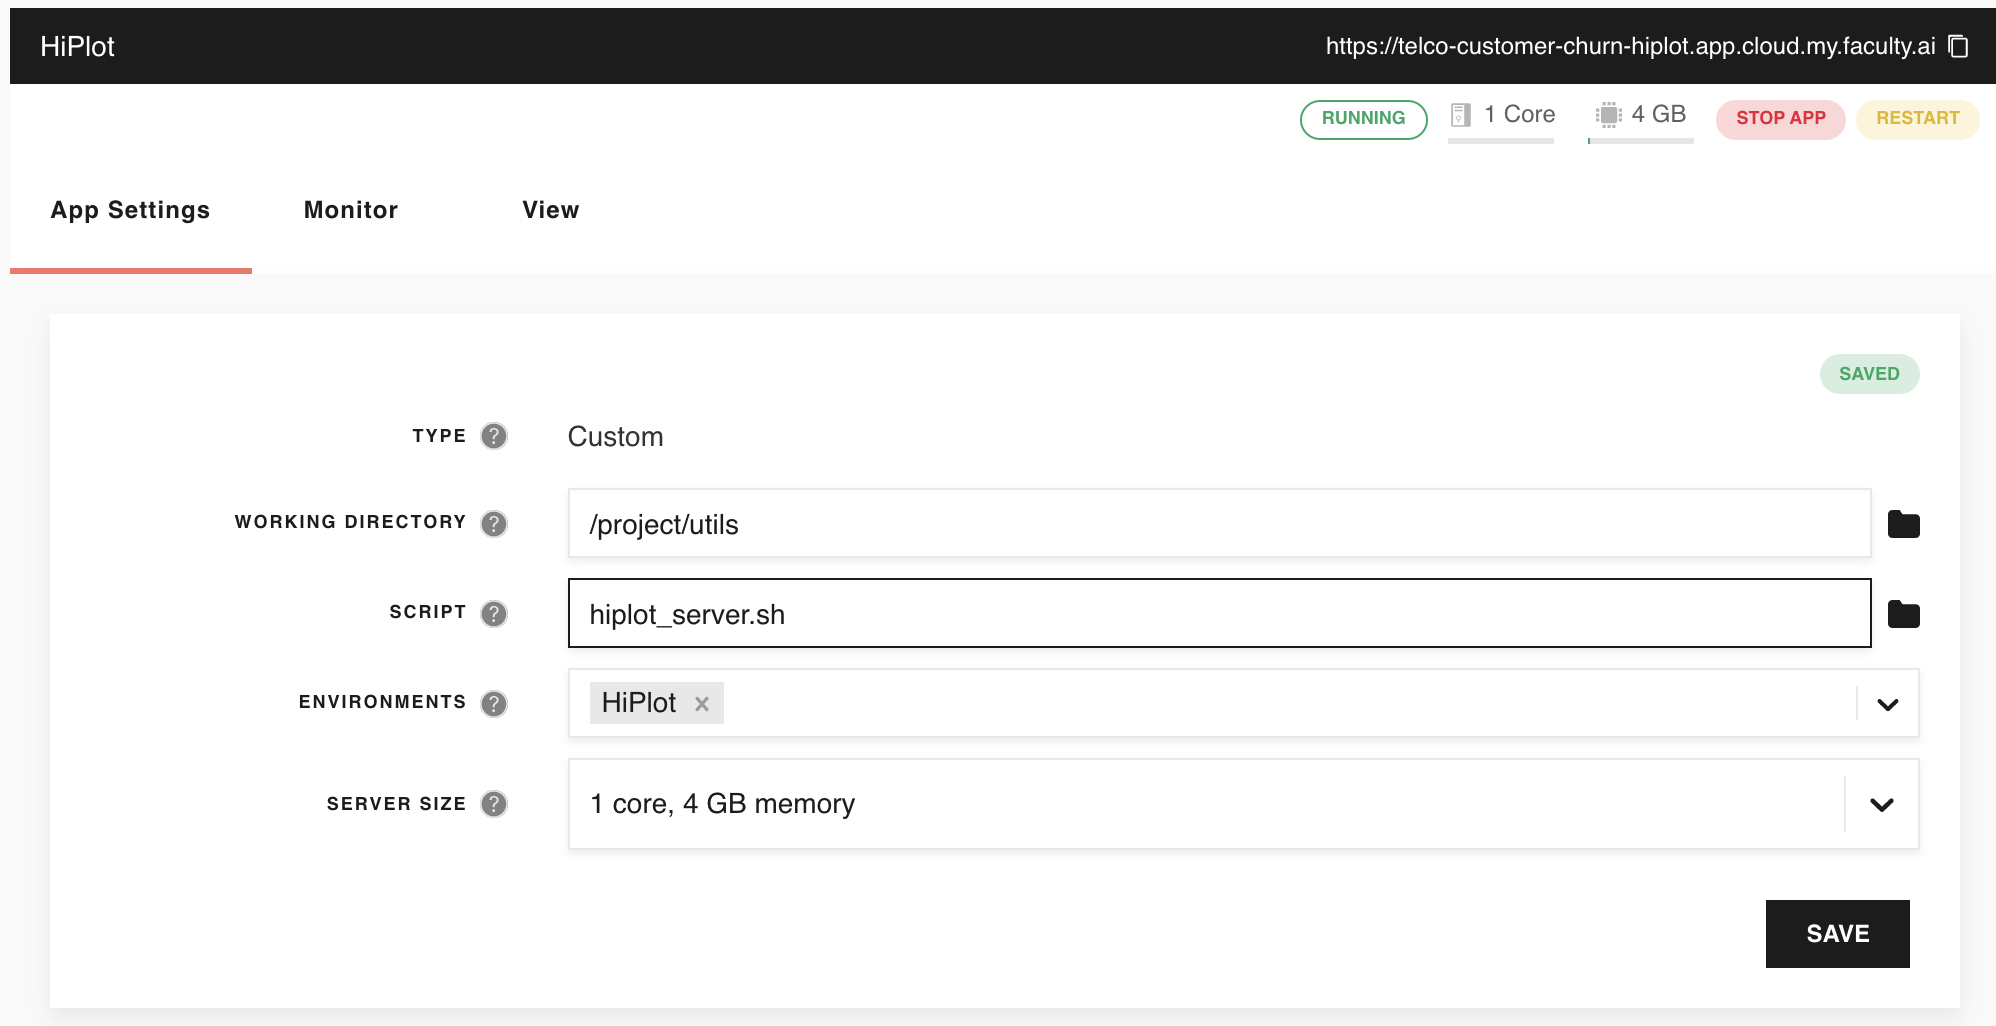
Using HiPlot as a stand-alone app
You can also use HiPlot’s built in webserver with hiplot-mlflow as a custom app on the Platform.
To do this, create a start-up script, here we’ll call it hiplot_server.sh
for example, somewhere in your workspace with the following contents.
#!/bin/bash

exec hiplot hiplot_mlflow.fetch_by_uri --port 8888
Then create an environment that installs
hiplot-mlflow as a Python 3 package.
Finally, set up the custom script app app to use that environment,
and run the hiplot_server.sh script.
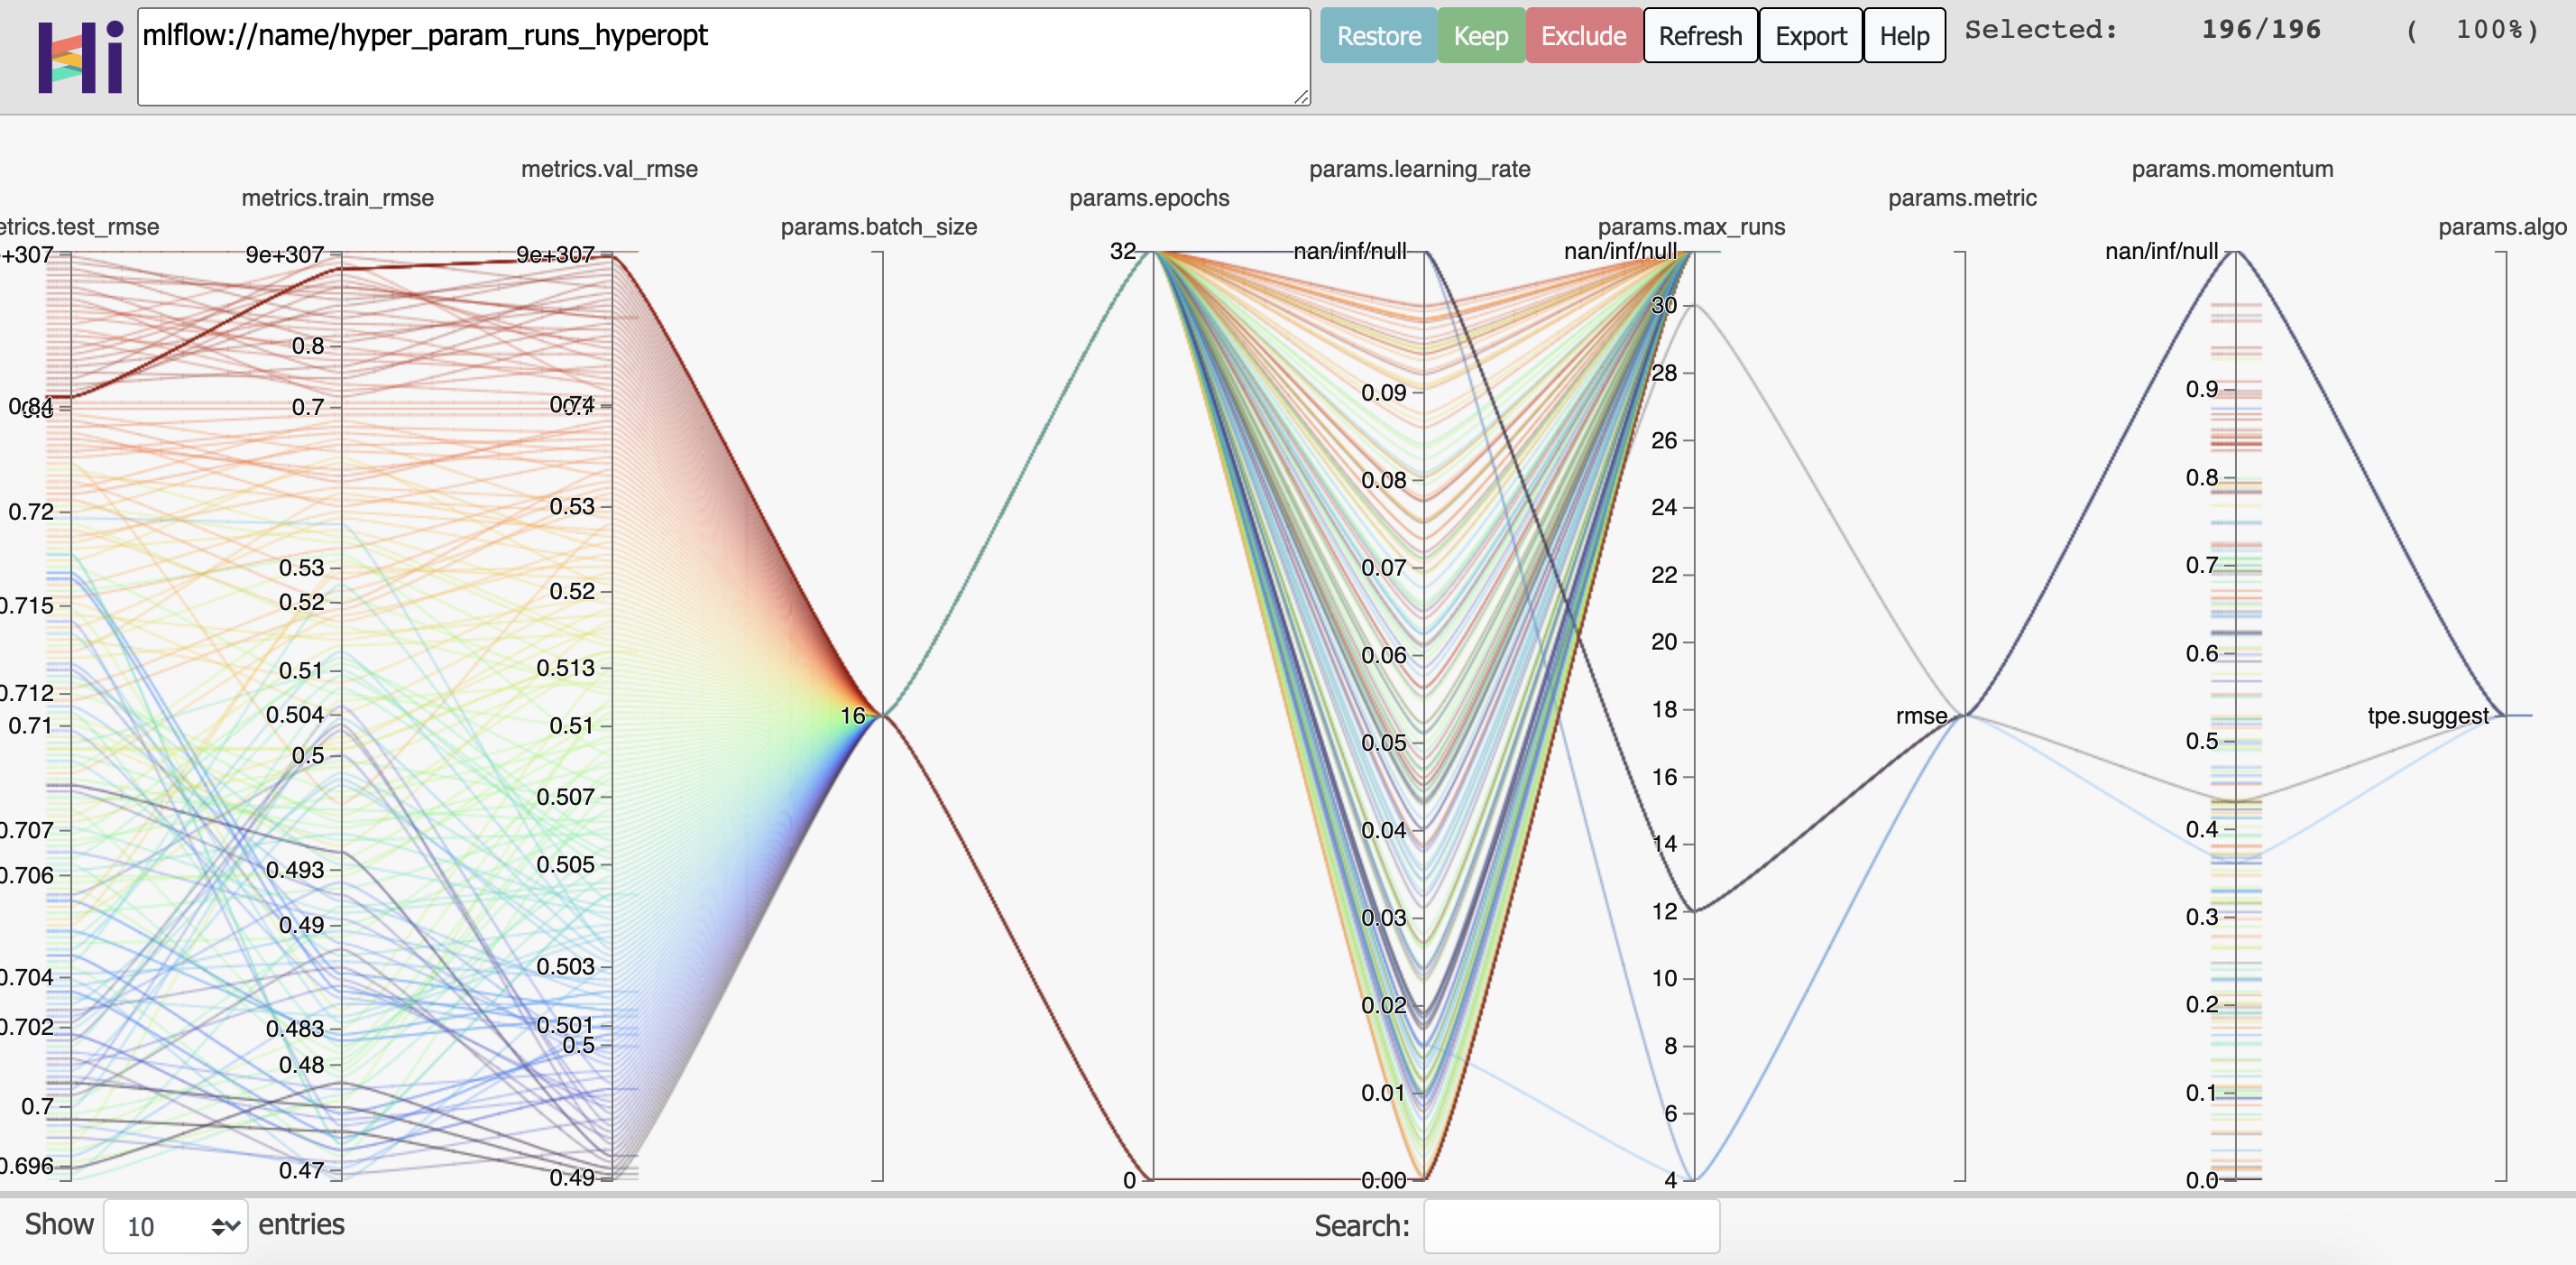
If you the navigate to the app’s URL, you can then use the mlflow://
schema to access MLflow experiments in HiPlot by either experiment name or ID,
for example:
mlflow://name/experiment-name
mlflow://id/0
You can also add tags=yes as a query string parameter to include tags in the output, for example:
mlflow://name/experiment-name?tags=yes
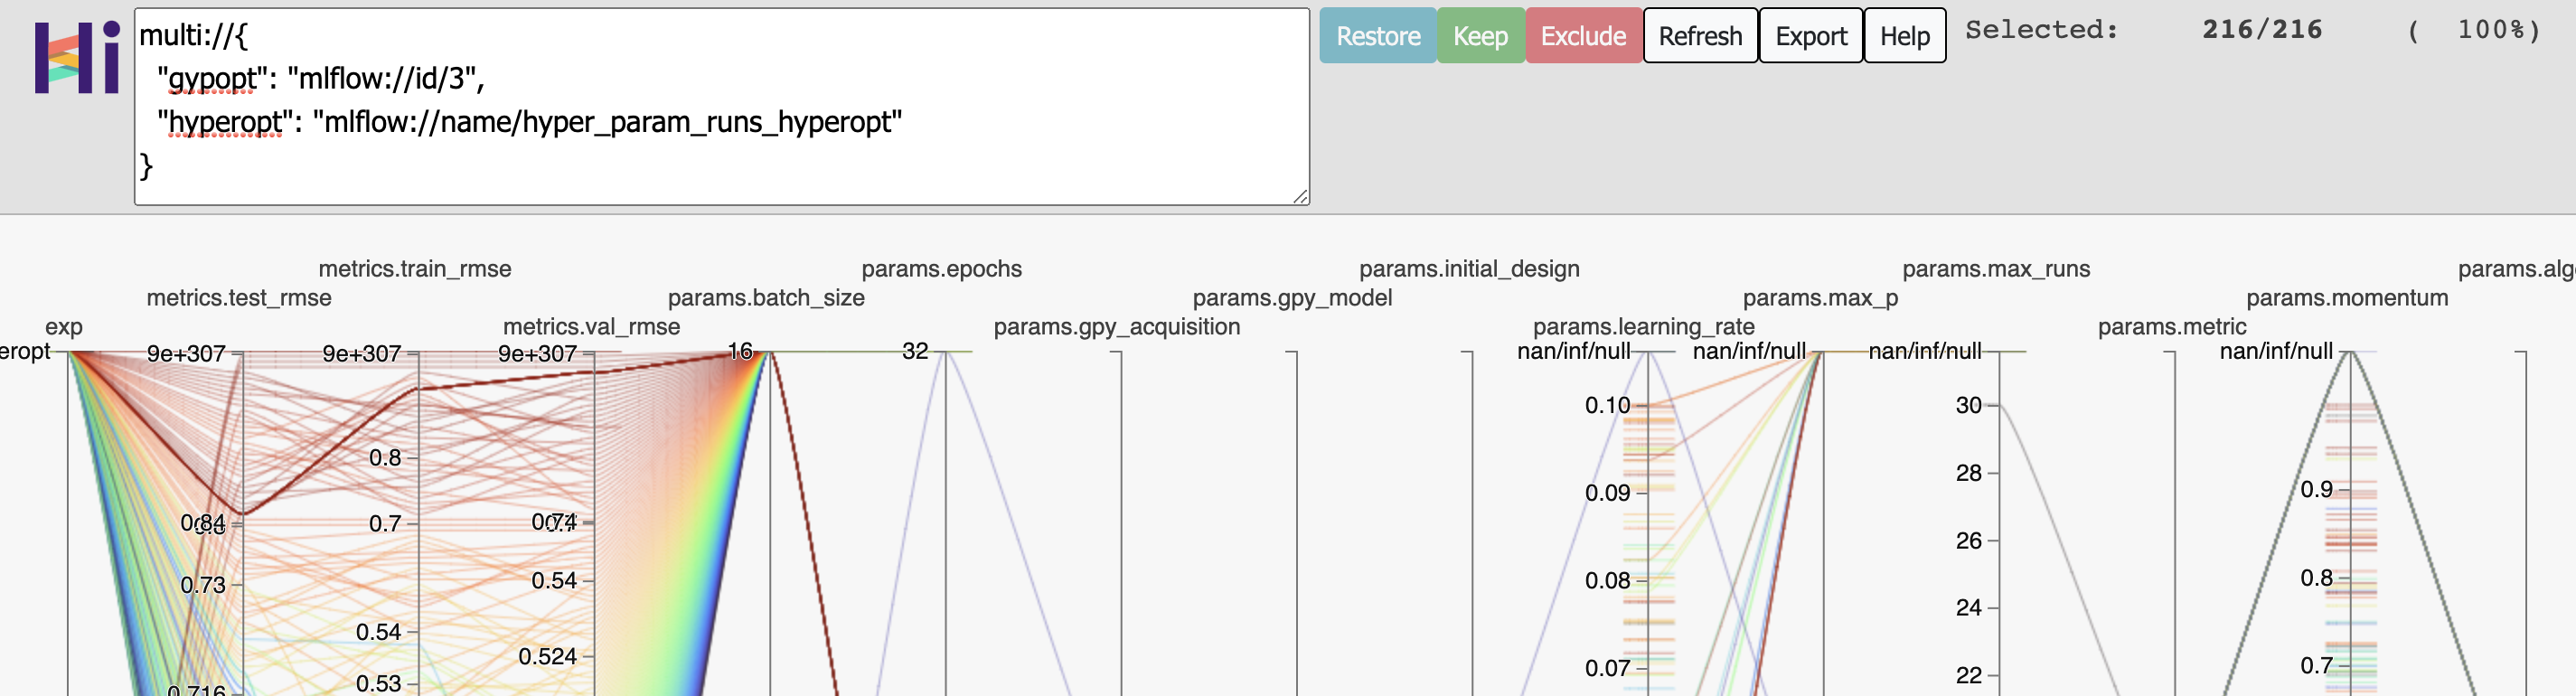
You can also use the multiple experiments loading syntax of HiPlot, either the list format:
multi://[
    "mlflow://id/1",
    "mlflow://name/another-experiment?tags=yes"
]
or the dictionary format, where you can define your own experiment labels:
multi://{
    "first-experiment": "mlflow://id/1",
    "another-experiment": "mlflow://name/another-experiment?tags=yes"
}
If you encounter any issue when plotting, such as a “HTTP error, check server logs / javascript console” message in the HiPlot interface, you can troubleshoot by navigating in the app’s control interface’s Monitor / App Logs view.